
After-hours trading shows volatile moves that often hint at what to expect when the market reopens.
• Late sessions reveal sharp price swings and high volume that can set off trends after the bell.
• Even a small price shift at night can build momentum for the next trading day.
• Traders monitor these moves closely as they may signal reactions to earnings or other key news.
This brief explains how after-hours activity shapes tomorrow’s session and why spotting these trends can provide a strategic edge.
After hours stock movers spark dynamic shifts
After hours stock movers show significant price and volume changes outside regular trading. Today, these fluctuations often signal reactions to key news that breaks after the bell. Real-time data as of Dec. 19, 2025, covers major indexes like Nasdaq 100, Dow Jones, and Russell 2000.
Key takeaways:
- Moves after the close can set the stage for the next trading day.
- Reactions to earnings, corporate updates, or economic reports drive these shifts when liquidity is thinner.
- Investors use stock screeners, market monitors, and earnings analyzers to track these trends in real time.
- The coverage spans markets across the USA, Canada, and Europe, providing a broad view of global dynamics.
Traders rely on these insights to adjust strategies, manage risk, and capture emerging momentum.
Identifying Top After Hours Gainers and Losers
Traders closely watch after-hours activity to spot market shifts. By looking at price changes and volume spikes, they can tell if a move is likely to last. A big jump in volume often signals more than a temporary blip.
Below is a table showing five stocks with notable moves in the after-hours session. These examples help traders compare post-session activity with regular trading figures, allowing quick strategy adjustments.
| Ticker | Company Name | Price Change (%) | Volume | Session Time |
|---|---|---|---|---|
| AAPL | Apple Inc. | +2.45% | 1.2M | After Hours |
| MSFT | Microsoft Corp. | +1.80% | 900K | After Hours |
| TSLA | Tesla Inc. | -3.50% | 1.8M | After Hours |
| AMZN | Amazon.com Inc. | +0.95% | 500K | After Hours |
| NFLX | Netflix Inc. | -2.10% | 750K | After Hours |
Real-time tracking like this lets traders spot liquidity shifts and adjust positions before the market reopens. This detailed view is essential for understanding market trends and planning tactical moves.
Key Drivers of After-Market Price Surges
When companies announce their earnings or release major news, stock prices often shift quickly after regular trading ends. If quarterly results deviate from expectations, shares can move sharply. Analyst upgrades or downgrades also prompt fast changes, as investors adjust their views based on the new data.
- Earnings and News: Stocks react strongly when quarterly results differ from forecasts. This signals that future performance may be different than expected.
- Corporate Actions: Dividend changes, stock splits, and updated IPO details can suddenly change investor interest and liquidity. Insider moves or trading by large stakeholders can hint at a company’s real value, prompting traders to reevaluate positions.
- Technical Factors: Tools like the relative strength index (RSI) and moving average convergence divergence (MACD) help traders spot early shifts. Bullish chart patterns and other technical setups can trigger algorithmic trades, adding extra volatility when liquidity is lower.
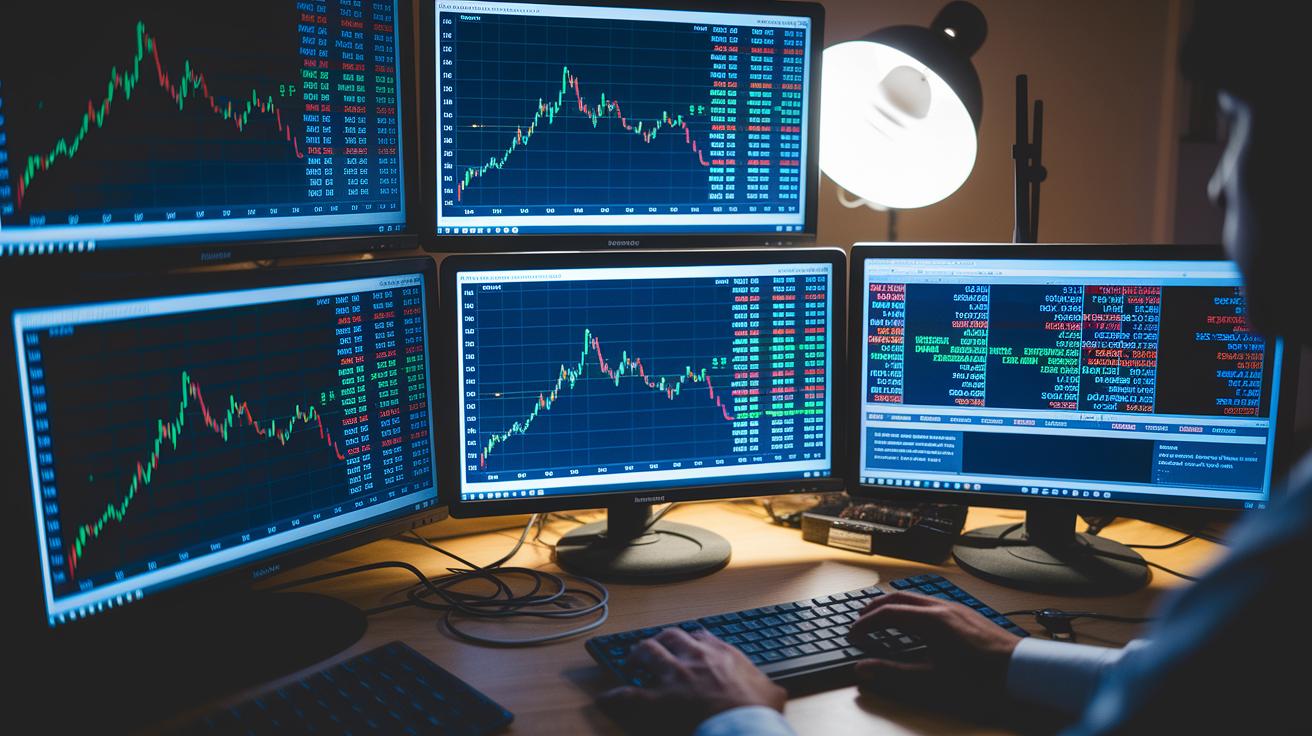
Essential Tools for Tracking Extended Session Market Leaders
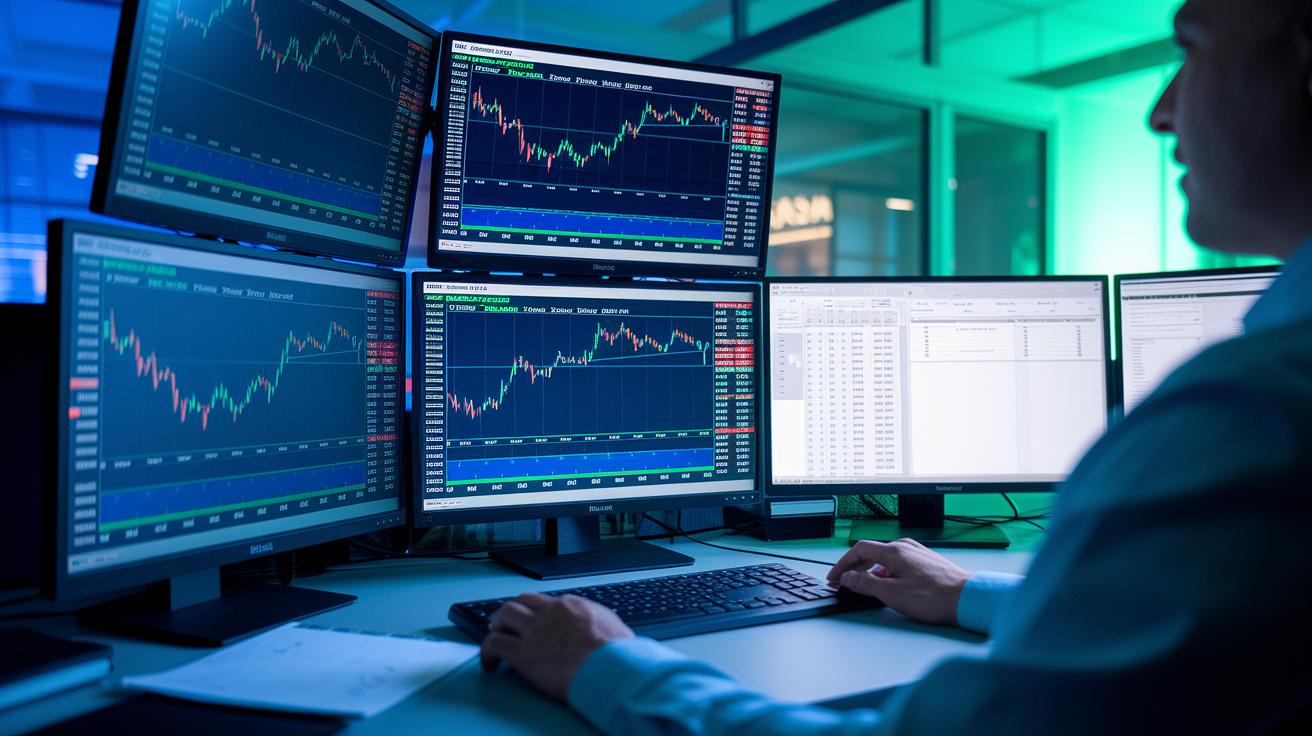
Traders use specialized tools to monitor real-time data during off-hour trading. Off-hour sessions often provide early market clues, and the right platform can cut analysis time. These systems make it easy to track slow trading and sudden volume spikes while offering clear charts and updated trend insights. For example, a trader can verify a price surge by comparing live volume numbers with past data during the extended session.
Key tools include:
- After-Hours Stock Screener
- Market Heatmap by Session
- Real-Time Price & Volume Charts
- Earnings Calendar & Analyzer
- Technical Indicator Dashboard
Each tool gives instant access to market data. The screener finds stocks that meet set criteria, while the heatmap shows activity across sessions. Real-time charts mix price movements with volume shifts, and the earnings tool tracks corporate updates that might move after-hour trading. The technical dashboard brings together key indicators like RSI and MACD, helping traders spot signals that could shape the next session.
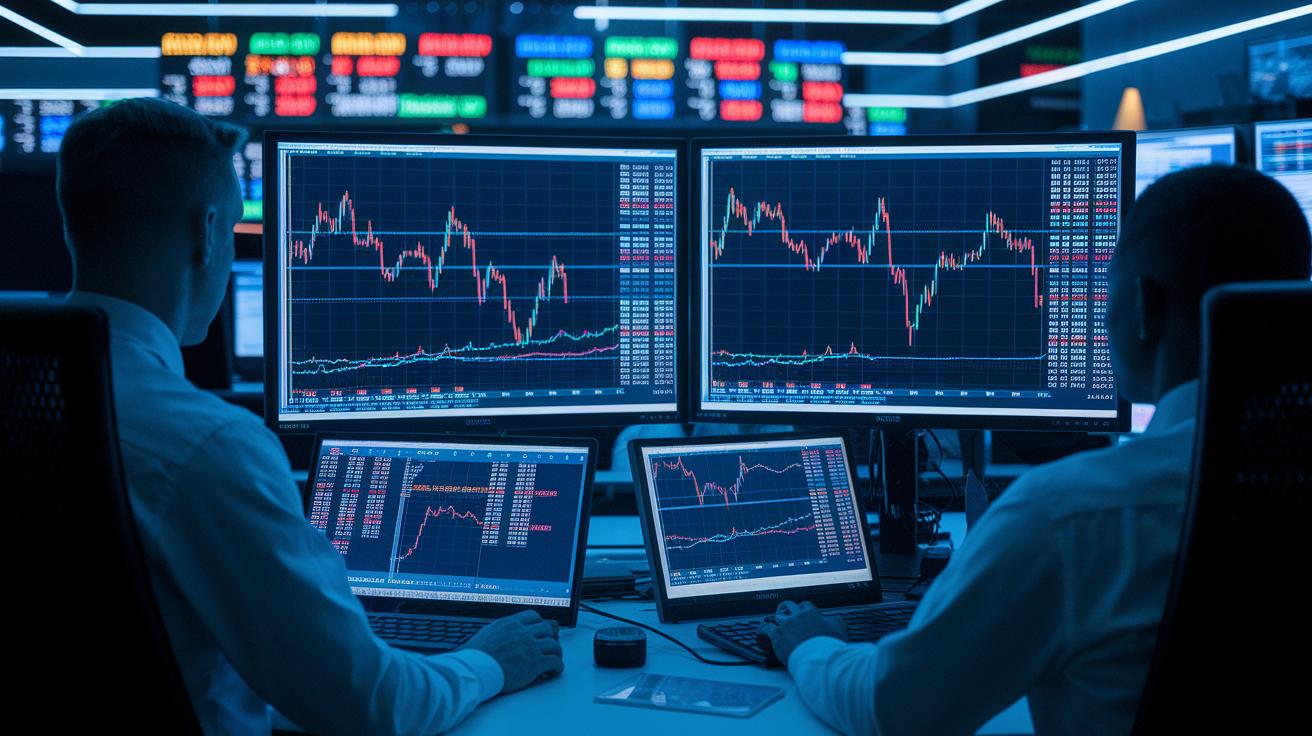
Understanding Late Session Stock Dynamics and Volatility
Late session trading experiences a shift in volume. As the regular session ends, liquidity drops so even small trades can move prices suddenly. This reduced participation leads to noticeable price gaps and unexpected liquidity spikes that may set the stage for overnight volatility.
In the United States, strong after-hours trading can signal a gap in the next session. Meanwhile, European and Canadian markets often show different volume trends because of local trading habits. International news and economic data can further influence investor sentiment, adding complexity to these patterns.
Traders should keep an eye on late session activity. Monitoring thinner liquidity and sudden price moves can help in adjusting strategies for the reopening session.
Strategies for Trading After-Bell Market Movers
Momentum breakout scalping in after-hours trading depends on spotting volatile moves within the first 15 minutes. Traders monitor live price changes and volume spikes using specialized screens. For instance, some tech stocks have jumped 2% in just 15 minutes when a breakout occurred. This tactic demands careful observation of key price levels and quick action.
Swing trading around late-session earnings surprises offers another approach. When earnings reports trigger unexpected moves, traders position themselves to follow a longer trend. They watch updated earnings data and price reactions in real time to capture gradual momentum. This strategy benefits from a longer window as the market absorbs news and shifts positions.
Technical pattern trades also play a role during off-hours. Traders use off-hour indicator thresholds like the Relative Strength Index (RSI) and Moving Average Convergence Divergence (MACD) to identify setups. In some cases, an off-hour RSI crossover has signaled moves of over 1.5%. By combining these indicators, traders develop disciplined and rules-based strategies.
Final Words
In the action, our guide broke down key elements of after hours stock movers. We covered post-market movers, explained why tracking price surges matters, and outlined the main drivers like earnings and technical indicators. The article also highlighted essential tools, late session dynamics, and actionable strategies that support quick decision-making on market shifts.
This recap reinforces the importance of after hours stock movers for understanding market volatility and setting up potential trades. Stay engaged and ready to act on the next opportunity.
FAQ
After hours stock market today
The after hours stock market today provides live price and volume updates after regular trading ends, enabling traders to monitor market reactions on major indices like Nasdaq 100 and Dow Jones.
After hours stock gainers today
The after hours stock gainers today list shows stocks experiencing notable price increases after market close, offering quick insights into stocks reacting to earnings, news, or corporate actions.
After hours stock market today live
The after hours stock market today live feature streams real-time data and charts after the regular session, allowing traders to track ongoing price and volume shifts immediately.
Best after-hours stock gainers today
The best after-hours stock gainers today are determined by significant post-market percentage increases, providing traders with key leads influenced by critical after-hours news or volume surges.
After hours Movers Benzinga
The after hours Movers Benzinga tool offers a curated list of stocks with major post-market movements, making it easier for traders to compare price changes and volume metrics efficiently.
After hours stock charts
The after hours stock charts display real-time post-market price movements and volume data, assisting traders in spotting trends and potential opportunities after the regular trading session.
Penny stock movers after hours
The penny stock movers after hours tracker monitors low-priced stocks that show significant volatility, providing traders with immediate insights into notable price swings outside standard market hours.

